In the old GraphFree site, you sometimes needed to use a separate scatter plot to add an open circle to a graph with a discontinuity.
In the new site, however, this hack is no longer necessary. You can add the graph and its discontinuity using a single Piecewise plot.
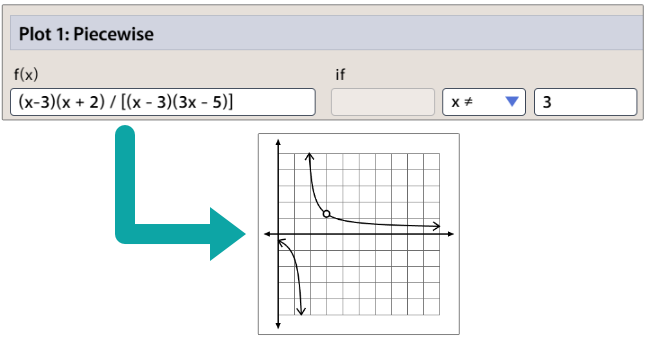
For example, suppose that you wish to graph the rational function (x - 3)(x + 2) / [(x - 3)(3x-5)]. This function has a removable discontinuity at x = 3 because the factor (x - 3) appears in both the numerator and denominator.
To graph this function complete with the open circle, enter it as a branch of the piecewise plot with the interval x ≠ 3, as shown below. Since x = 3 is excluded from the graph, GraphFree will place the open circle to represent the discontinuity.