
Basic Shading
You can shade the region above, below, or between curves in GraphFree by entering a single point in the interior of the region you wish to shade.
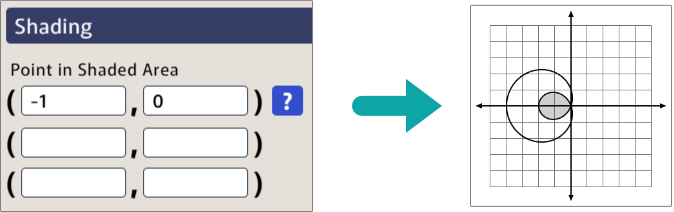
Be sure to pick a point that is clearly in the interior—neither on nor very close to the edge. Neither (-2, 0) nor (-1.9999, 0) would have worked in this example.
On a Polar Grid
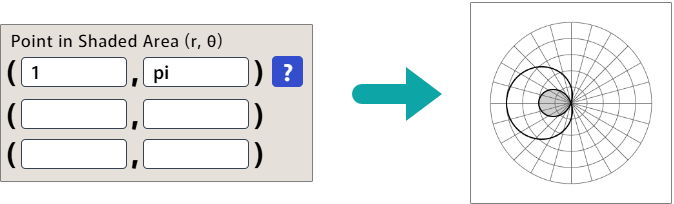
If you are using the polar grid type, you need to enter the points in the form (r, θ), with θ in radians, as shown below.
Keep Points Within Graph Window
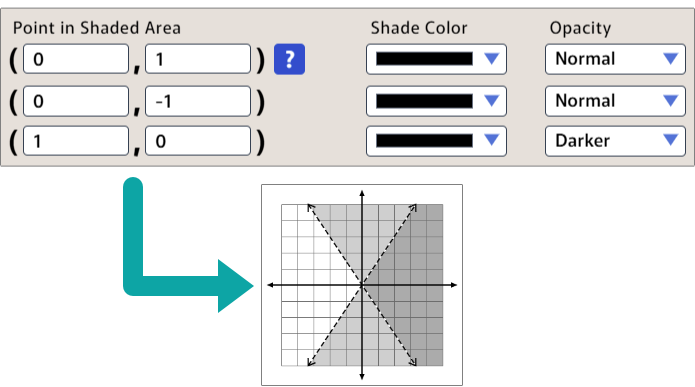
Consider the example below, which illustrates the regions y > -3x/2 and y < 3x/2.
It might be tempting to enter (0, 10) for the region above -3x/2, because that point is certainly a solution of the inequality. But it would not work, because (0, 10) is not visible on the graph window.
This example also shows how you can use normal and darker opacity values to illustrate an intersecting region, by making the portion of the graph that satisfies both inequalities darker.
Flood Fill and Why It Matters
GraphFree uses the flood fill method to shade regions. In other words, it starts at the point you specify, and it shades everything it finds around it, stopping at the boundaries set by your graphs.
This method gives GraphFree tremendous flexibility to shade all sorts of bounded regions easily. (Notice that you didn't need to specify the minimum and maximum θ to shade the polar examples above.) It also means that shading stops at any boundaries, even from a different plot. This is why you had to specify the point (1, 0) separately in the example above.