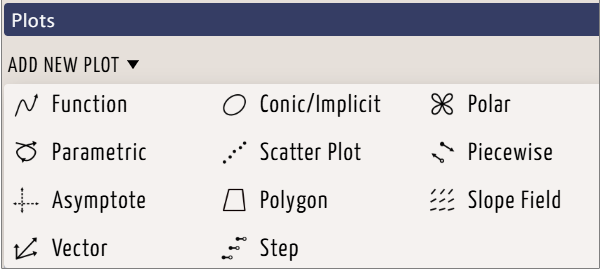
To add a new plot, click the Add New Plot button, and select the type of plot you wish. The types of plots available differ according to the grid type you are working on. The menu show below is the for the Cartesian grid. The plot types category in this knowledge base describes each type of plot in more detail.
After you have selected a plot type, the settings for that plot will appear, along with a plot command bar. The style settings will be set to the default for that plot type. Users with a Boost membership can customize these defaults on the Favorites page under the My Settings menu.
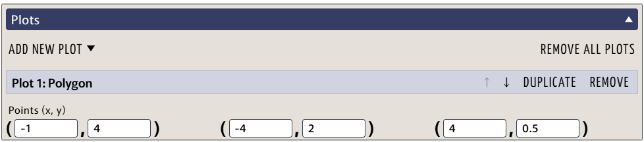
The Duplicate button will create another copy of the plot with all of the same settings, including the style settings . This setting is designed to save you time when you want another plot very similar to the one you already have.
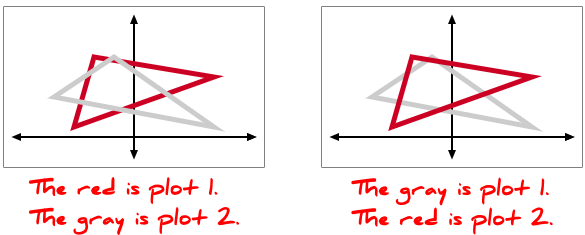
If you have two or more plots, the arrow buttons will become active. You will not need these often, but they are useful when it matters which plot is drawn on top of another. The plots with the greater number (toward the bottom) will be drawn on top of those with lower plot numbers, and you can use the arrows to change the order of the plots.