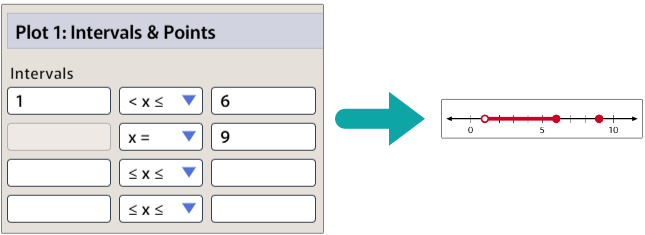
When graphing on a number line, you will use the intervals & points plot type. You may enter intervals in spaces provided, or use the "x =" option to graph a single points.
Infinite intervals are shown with arrows as expected.
On this page