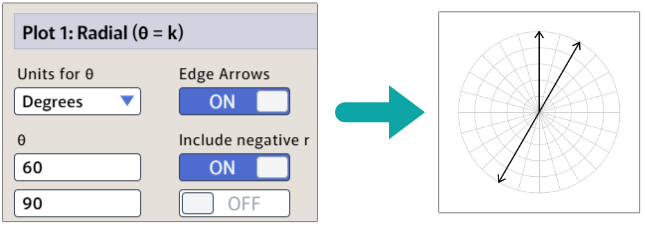
The radial plot is used only on a polar gird. (If you want to plot a ray on a cartesian grid, you can use the vector plot.) Radial plots are lines of the form θ = k. Your radial lines may have an endpoint at the center (graphing only r ≥ 0), or they may extend in both directions (-∞ ≤ r ≤ ∞). This is controlled by the "Include negative r" toggle.
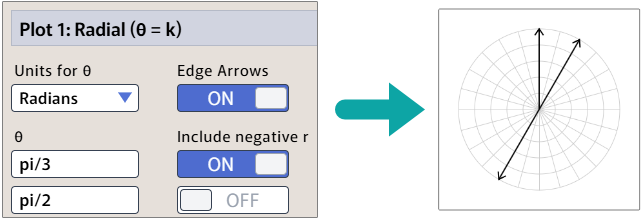
You may also enter θ in degrees.