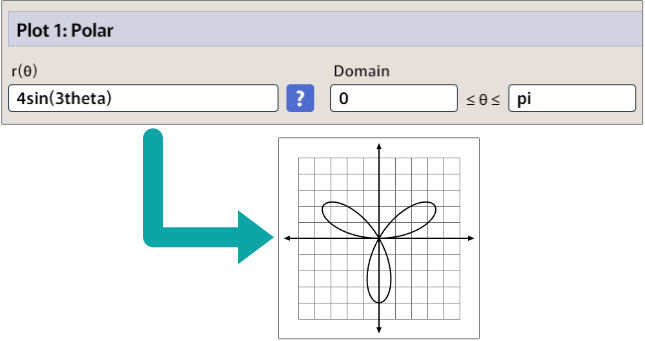
You can graph polar curves on either a polar or Cartesian grid. The data entry is identical for each case. Enter an expression in terms of θ for r(θ), and enter the minimum and maximum θ for the domain.
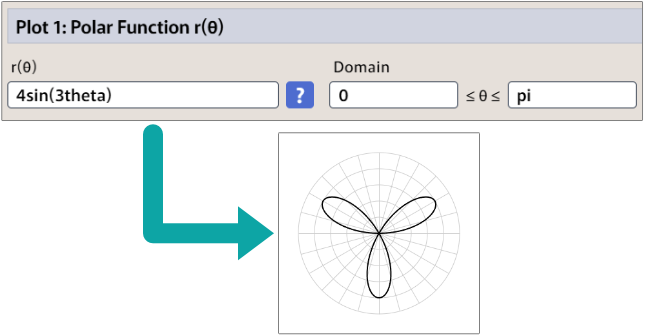
On a polar grid, it looks like this:
And here's the same on a Cartesian grid: