
The step plot can graph the greatest integer (floor) function and the smallest integer (ceiling) function without resorting to a tedious group of piecewise functions.

You can also enter transformations.
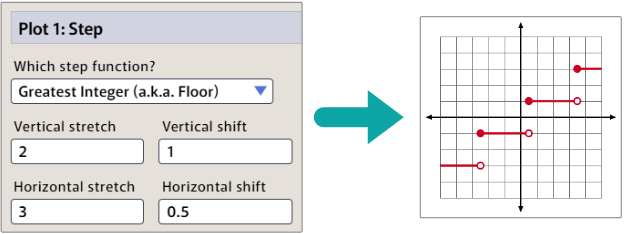
In the example above, the greatest integer function has been stretched vertically by a factor of 2 and horizontally by 3, then translated 1 unit up and 0.5 to the right. Note that both the horizontal and vertical stretch transformations are performed before the respective shifts.