The asymptotes plot allows you to enter several asymptotes at once without resorting to multiple function plots. Horizontal, vertical, and slant asymptotes are all supported.
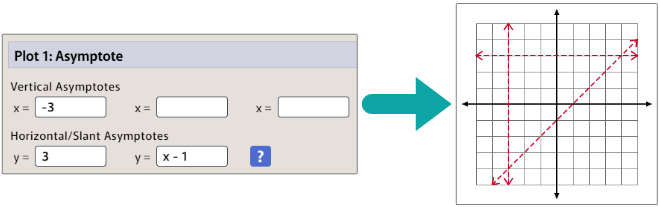
In the horizontal/slant asymptote section, you may enter a number for a horizontal asymptote or a linear expression for a slant asymptote.
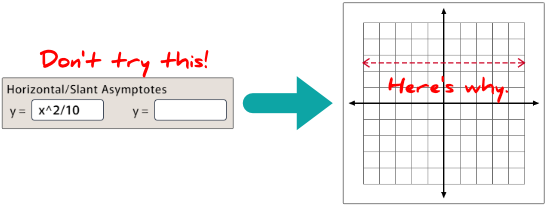
Warning: Do not try to sneak in a non-linear expression to save yourself a separate function plot. GraphFree calculates only two points to plot each asymptote, so If you enter a non-linear expression, your graph will be wrong.