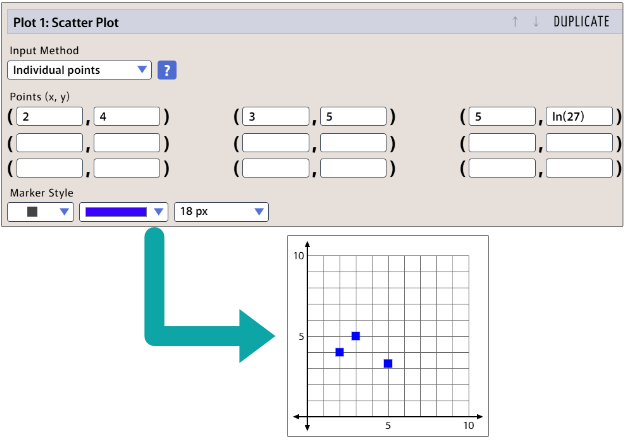
When you graph ordered pairs on a scatter plot, you can still use calculations and built-in functions, as shown by the ln(27) entry in the third point of the example below.
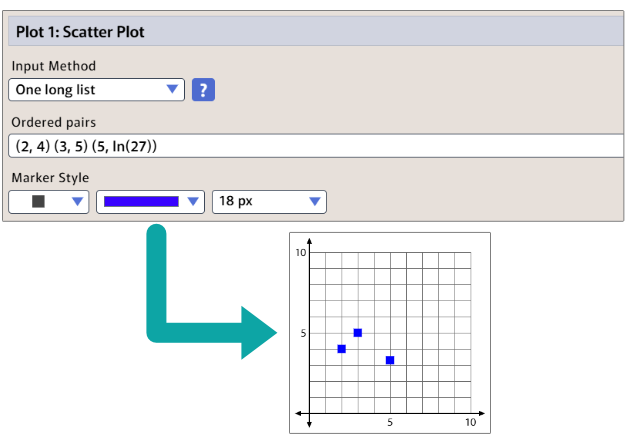
You can also change the Input Method to "One Long List" if you prefer. If you want to paste in text from an external source instead of typing it, this is the method you would use. You may also use it if you want to enter more than nine points in a single scatter plot. (The limit is fifty points.)
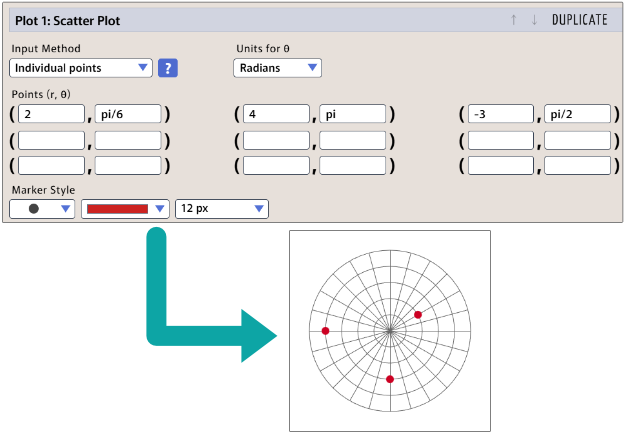
On a Polar Grid
If you are using the scatter plot type on a polar grid, you will enter the points in the format (r,θ). There is a units setting so that you may choose whether to express θ in degrees or radians.