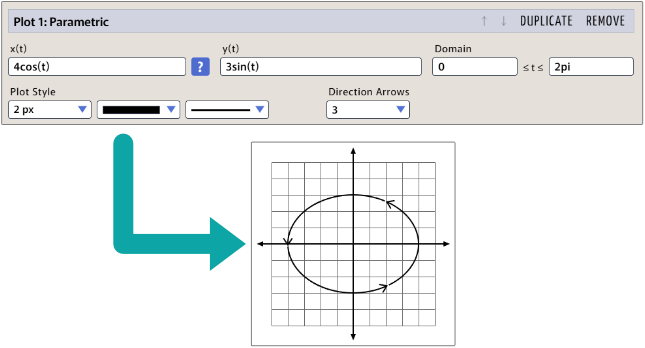
For parametric plots, enter expressions for x and y in terms of t. (If you enter an expression in terms of x out of habit, GraphFree will fix it for you.)
Be sure to include the domain for t that you would like to graph over. You may also include the traditional arrows to indicate the direction of increasing t. You may include as many as four arrows, or none at all, as works best for your plot.