
To use the features described on this page, you must be a Boost level subscriber.
What Are Favorites?
You can use the favorites feature to save your most commonly used settings, saving you the trouble of entering the same settings over and over again.
These favorites are stored on your computer's local storage. Most browsers allot enough space to local storage so that these settings will be held indefinitely, unless use browser tools you delete them yourself.
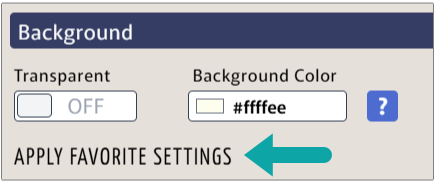
Background & Grid Settings
Whenever the values you have entered for your graph do not match your saved favorites, the Apply Favorite Settings button will appear. In the example below, the pale yellow background color does not match the plain white stored as the favorite, so the button show. If you click the button, all settings in that panel will be set to match the favorite, and the button will disappear.
Plot Sizes
The plot sizes work nearly the same way as the grid settings, except that all of the different grids’ settings are contained in the same panel on the Favorites page. However, if you apply the favorite size to the cartesian grid, the polar grid and others will not be changed. Each grid’s size settings are applied separately.
Also, the extra space settings are always assumed to be zero in the favorites, since they are not needed often. (Captions and many axis labels allot appropriate space automatically, so you don’t need the extra space for those.)
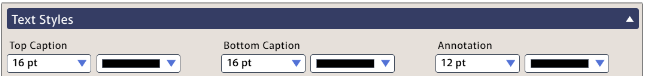
Text Styles
The styles for the top caption, bottom caption, and annotations are all kept in the same panel. If you apply those styles in their respective panels on he graphing pages, the texts of the captions and annotations will not change, only the text styles.
Plot Styles (Line, Marker, Etc.)
Whenever you use the Add New Plot button to add a plot to your graph, the graph will start with the line or marker style saved in your favorites.
Most of the plot types will use the Plot Line Style setting. Exceptions include the asymptote plot, which uses a separate favorite setting since most users prefer those to be dotted lines, and the interval plot (for a number line). The interval plot uses a separate favorites setting since a larger line width often looks better for intervals. The polygon plot also has its own settings to allow you to set a fill style.
You can also set favorite marker styles for scatter plots and the scatter plots on any grid type (cartesian, polar, or semi-log) will all use that style.